TaxGPT usage and data analysis
On this page
Overview
Large Language Models (LLMs) are white hot right now in the hype cycle, but one thing we don’t see much of is actual usage data. AI widgets seem to be popping up on every app I have on my laptop, but who is even using these things, and for what? While there's a lot of buzz about AI’s potential, there’s not a lot of hard data on Actually Existing AI usage.
Fear not, courageous reader! It just so happens I am the creator of TaxGPT, an award-winning AI chatbot that answers Canadian tax questions. I came here to analyze data and lose money, and I’m all out of money.
This article looks at actual usage patterns from a non-vapourware AI chatbot — whether you’re building one yourself or just want to flame me on Twitter X, read on to learn all my secrets.
Intro
In March 2024, I relaunched the new and improved TaxGPT.ca, which combines publicly-available government data with OpenAI’s API to generate answers about Canadian tax filing. TaxGPT uses a technique called retrieval-augmented generation (RAG) which you can think of as similar to ‘ChatGPT for your data.’
I offer TaxGPT for free, so I don’t use paid advertising. Most people find their way to TaxGPT through Google (or Bing!), or from the articles in the Daily Hive and National Post. While it hasn’t exactly gone viral, TaxGPT nevertheless generates a healthy amount of traffic by providing a useful service that people seek out.
TaxGPT has always been a public-interest project (it even won a public service award), so in this article I’ll be sharing and analyzing usage data from the 2024 tax season (March-April 2024). The analysis was done in partnership with Mehdi Mammadov, a data scientist with Antennai LLC. In particular, I’ll focus on:
- Total usage
- Trending topics
- Feedback
- Question categorization (relevance and complexity)
Overall, I find that AI assistants like TaxGPT have plenty of potential but they are definitely not magic. Like any product, successful AI applications require a deep understanding of your audience, frequent iteration cycles, and creating feedback loops to monitor real-world performance. AI is definitely a potent ingredient in your broth, but you still have to make the rest of the soup.
Total usage
First things first, the tax filing deadline for most people in Canada in 2024 was April 30th at midnight.
I relaunched TaxGPT on March 4th, so my dataset considers all responses received between March 4th-April 30th. In that period, how many people used TaxGPT? And what usage patterns can we discern?
Data
| Description | Count |
|---|---|
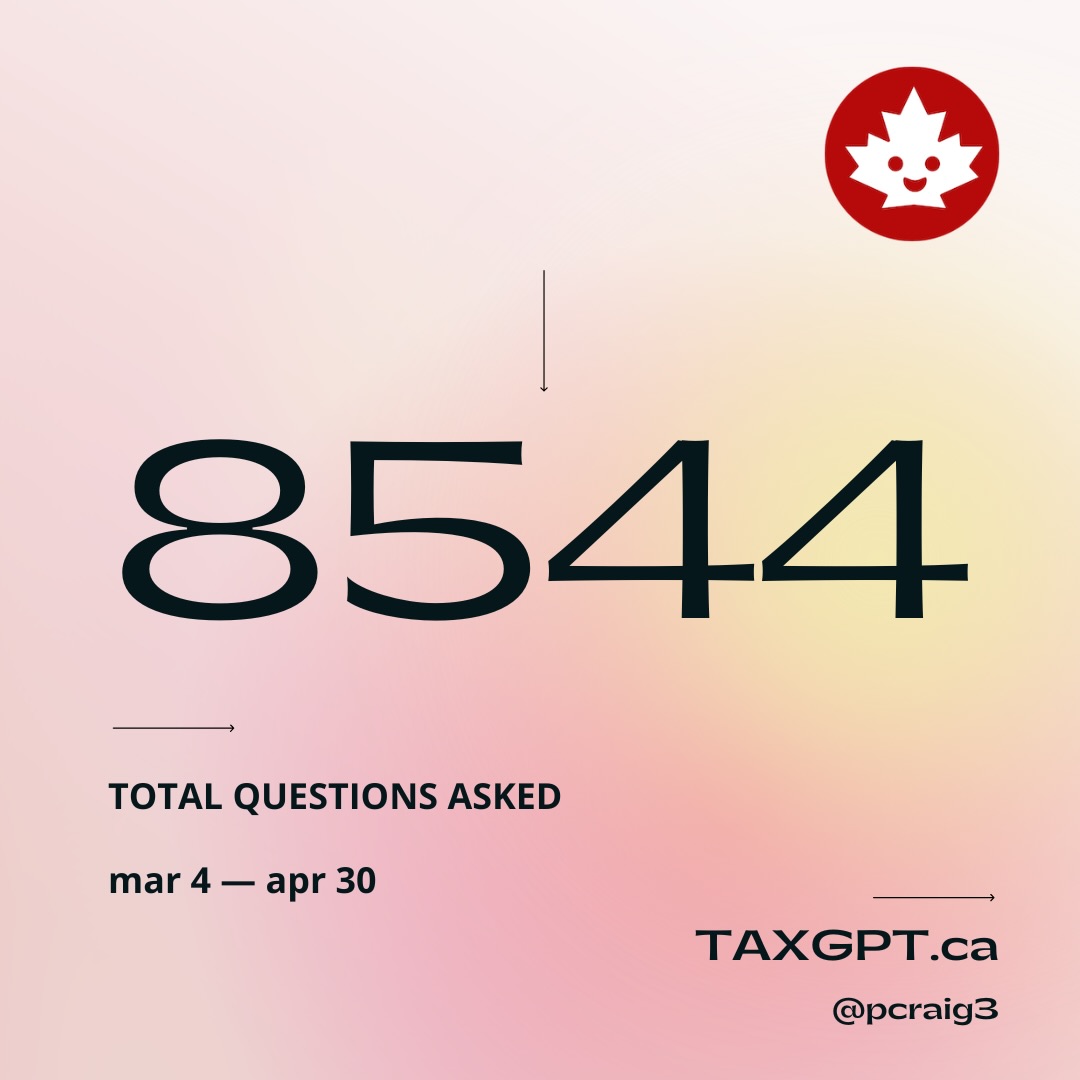
| Total questions | 8544 |
| Average questions per user | 2.7 |
| Avg. questions per day | 145 |
| Avg. questions per day (March 2024) | 90 |
| Avg. questions per day (April 2024) | 200 |
| Highest no. of questions asked in 1 day (April 29) | 584 |

Analysis
Throughout the filing period, TaxGPT received an average 145 questions per day, but usage went up as the tax filing deadline approached, which is what we would expect to see.
The average number of questions per day doubled between March and April, and peak usage was on April 29th, 1 day before the deadline.
TaxGPT doesn’t rely on paid advertising, so these 8.5k questions are organic. Clearly, there is an audience here. And encouragingly, the large majority of questions that come in are actually relevant to tax filing (as we’ll see later). This means people are using the service for its intended purpose, not spamming it or trying to get it to say stupid things. Tax filing is complex, and LLMs are pretty good at providing simple explanations for complex subjects, so we can posit that TaxGPT has found a reasonable product-market fit.
Finally, we see that the average user asks 2.7 questions, which is good. It means that a large segment of people stick around to ask follow-up questions, and don’t just abandon the service after one question (although that happens too).
Next steps
‘Total questions’ tells how many people TaxGPT has reached, but total questions per user is a better measure of effectiveness. We can assume the more questions someone asks, the more useful they find it.
As a next step, it would make sense to do a more in-depth analysis on what drop-off patterns look like. My hypothesis is that they reach the limits of what public data is able to answer, which is something I consider below.
Trending topics
Okay, so people are using TaxGPT, but what are they using it for?
Most answers returned by TaxGPT include sources back to the original content it uses to answer the question. When a source is returned frequently, it generally means many people are asking questions relevant to that source. So let’s see which sources are cited most often, and what that tells us about the audience for TaxGPT.
Data
| Description | Count |
|---|---|
| All possible sources | 870 |
| Sources returned more than 100 times | 81 |
Top 5 sources (and themes)
- Completing a basic tax return (Basic tax info)
- Questions and answers about filing your taxes (Basic tax info)
- Self-employed Business Income: Chapter 3 – Expenses (Business expenses)
- Webinar - Indigenous peoples: Get your benefits and credits (Basic tax info)
- Types of operating expenses (Business expenses)
Analysis
Out of 870 total sources, about 10% (81) are returned frequently, which indicates there are themes to what people are asking about.
This is clear when we look at the top 5 sources. Specifically, there are 2 kinds of pages which rise to the top:
- basic information about tax filing
- specialized information about business expenses
There is clearly an audience looking for basic information to get familiarized with tax filing, and another audience interested in more specialized information related to business taxes — not surprising given that this will be a new subject for many entrepreneurs.
Next steps
This is interesting because it suggests two possible strategies for applications like TaxGPT:
- Create a general-purpose tool to familiarize a broad audience with a topic
- Create a specialized tool for a niche audience segment
Anyone building a product needs to understand their audience(s). In organizations with low product maturity, the instinct is to have your cake and eat it too: ‘Let’s do both: build a tool that helps beginners as well as experts.’ However, these are different audiences — one is more casual, the other more sophisticated. Deciding what your product should do depends on your goals.
Do you want a general-purpose tool to maximize audience potential? Or, do you prefer a specialized audience, smaller but more loyal? What is the tolerance of each audience towards failed questions?
To build a successful large product, start by building a successful small product. AI can do a lot of things, but it can’t prioritize your roadmap for you.
Feedback
Like many AI applications, TaxGPT uses thumbs-up/down icons to collect explicit feedback from users on what they think of the answers that come back. Let’s look at how many people actually use them.
Data
| Description | Count |
|---|---|
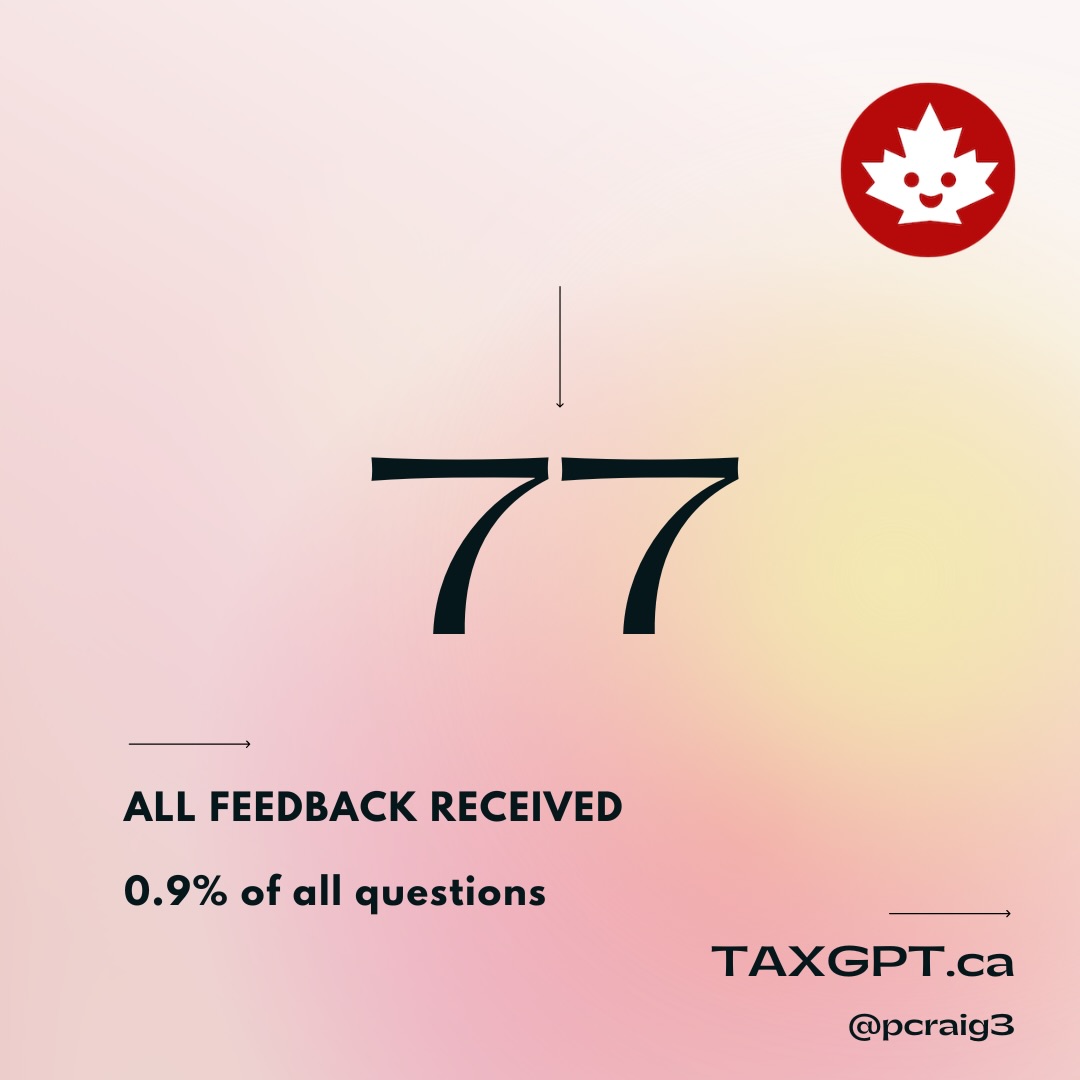
| Total feedback received | 77 |
| Positive feedback | 43 |
| Negative feedback | 34 |

Analysis
Honestly, I was surprised most of the feedback was positive. I think TaxGPT is a pretty good (free!) service, but I had assumed that the people most motivated to leave feedback would be those who were upset. (And bad feedback is useful, because it helps me understand what needs to be fixed.)
However, when you run the numbers on feedback given as a proportion of total answers, you get 0.9% (77/8544 == 0.9). Less than 1% of people left explicit feedback, which is a small minority.
Next steps
Since we are seeing a proportionally very low amount of explicit feedback, what other mechanisms can we build to understand how the application is performing?
My answer to this has been to set up automatic tagging to evaluate relevance and estimated complexity.
Relevance
Custom chatbots sometimes return baffling responses to irrelevant inputs, and, in the worst case, are subject to ‘prompt injection’ attacks that trick your bot into responding in offensive or embarrassing ways. To guard against this, a pragmatic step in any AI pipeline includes testing inputs for basic relevance.
Shortly after launch, I started tagging incoming questions as ‘relevant’ or ‘not relevant’ to tax filing.
Data
| Description | Count |
|---|---|
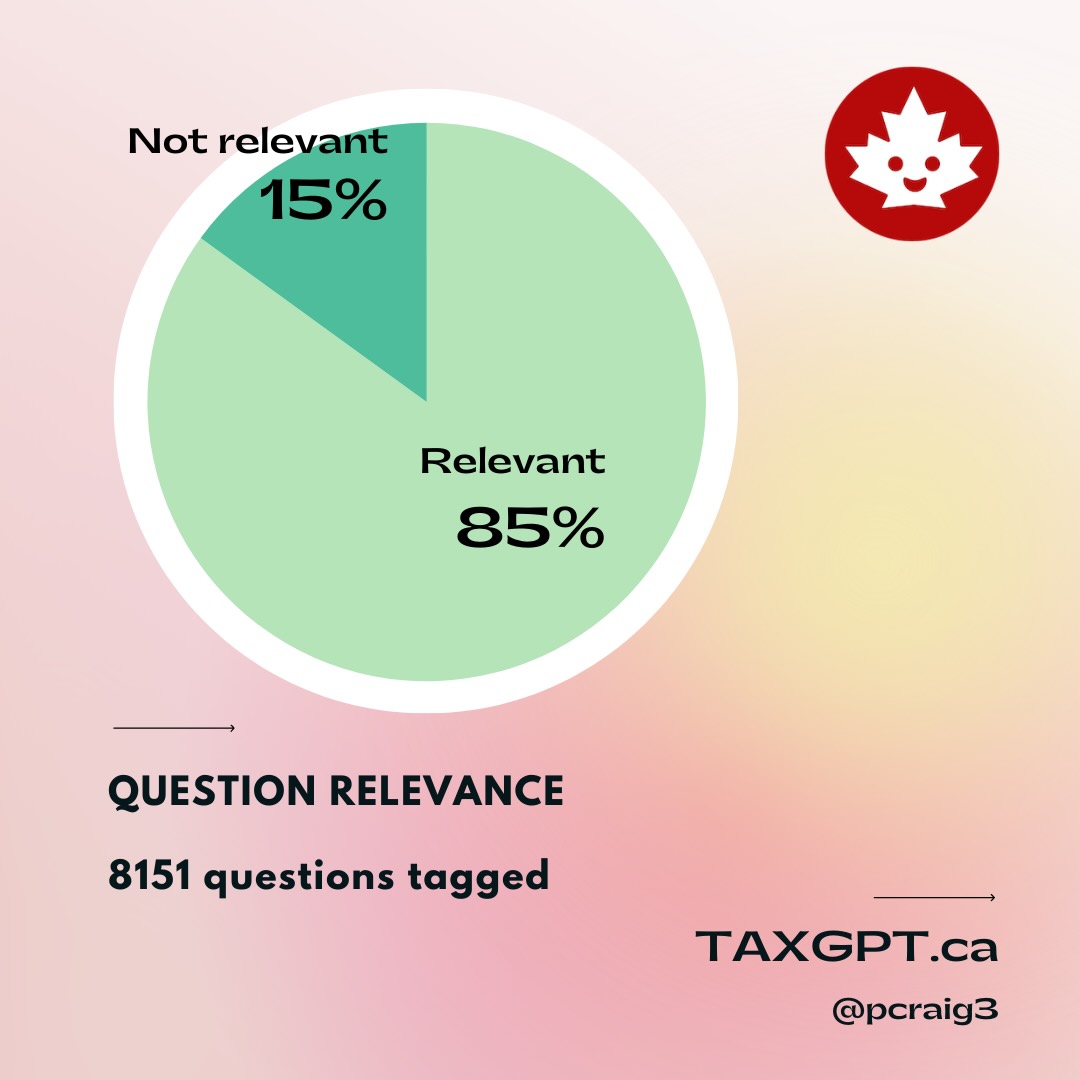
| Relevant questions | 6927 (85%) |
| Not relevant | 1224 (15%) |

Analysis
Most users are asking relevant questions rather than spamming the pipeline with gibberish or non-tax-related questions. However, shortly after releasing this feature, I noticed a pattern in some of the questions that were being wrongly tagged as ‘not relevant’:
what line is it?What does that equal?How would it be deducted ?So in total I get 8 years?
These are all follow-up questions, which often do not make sense on their own and require an understanding of past questions to gauge their relevance. I addressed this issue once I noticed it, but it requires monitoring.
Next steps
Creating a multi-stage pipeline is a smart way to architect your AI app, but you can’t be asleep at the wheel.
In this case, the obvious task is to keep an eye on the ‘not relevant’ questions to make sure that valid queries aren’t being thrown out.
Complexity
Due to the nature of data the system has to work with, TaxGPT is great at answering introductory tax questions but struggles to provide relevant responses to complex, ’expert-level’ questions. As you can imagine, complex tax questions often cannot be conclusively answered using only publicly available information.
Working closely with Mehdi Mammadov, a data scientist with Antennai LLC, we came up with an approach for classifying incoming questions on a 3-tier ‘complexity’ scale. Every question submitted to TaxGPT is estimated to be either “easy”, “medium” or “hard” to answer.
Data
| Description | Count |
|---|---|
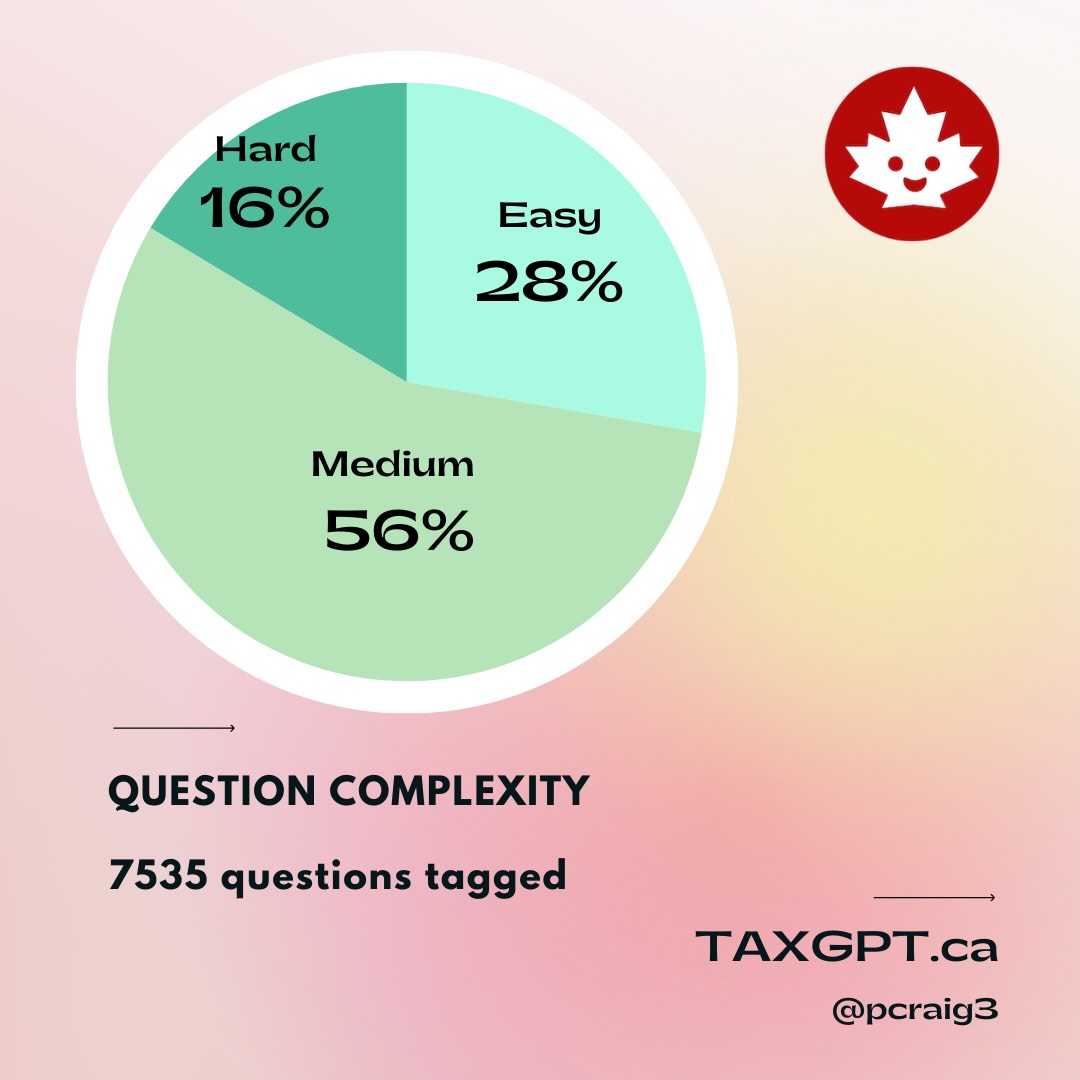
| Easy-complexity | 2088 (28%) |
| Medium-complexity | 4213 (56%) |
| Hard-complexity | 1234 (16%) |

Analysis
We can see that most people ask ‘medium-complexity’ questions, which makes sense. This is a natural point at which people start looking for advice.
Almost a third are ‘easy-complexity’ questions, which are the kinds of questions that TaxGPT is generally able to ace.
‘Hard-complexity’ questions compose the smallest group, but not so small I can ignore them. This is the segment that is hardest to solve for.
Previously, I discussed how few people give explicit feedback, but here we have an interesting opportunity to analyze the performance of TaxGPT through user behaviour.
One hypothesis would be that people start with ‘easy’ questions, get a good answer, and then ask tougher questions. Eventually, they ask questions that are too complex and then they give up. In theory, this ‘complexity cliff’ is where users drop off because they reach a point where their questions cannot be answered using publicly-available tax guidance.
Next steps
The next step here would be to do a deeper analysis of user activity and validate if behaviour patterns match the theory, or if there is something else going on. An exercise for a future post, perhaps.
Conclusion
AI is a remarkable technology, but it is so novel that best practices and techniques are still emerging. Don’t expect that sprinkling some AI into your app will be a shortcut to building a real product.
There absolutely appears to be a market for apps like TaxGPT, but, as with any product with an audience, you need to be clear on who that audience is and what they are looking for. If you don’t know what the user needs are, you won’t build the right thing. And whatever you do launch, you need to be monitoring and building feedback loops around.
AI-powered development is an exciting frontier and one in which everyone is learning at the same time. I’m glad to be able to share my insights and expertise, and hopefully help others at the start of their journeys.
I’m also available for a chat at “paul [a] pcraig [dot] ca” if you are at the start of your AI journey! The best way to learn is by doing, the second best way is to learn from somebody that has done it already.
